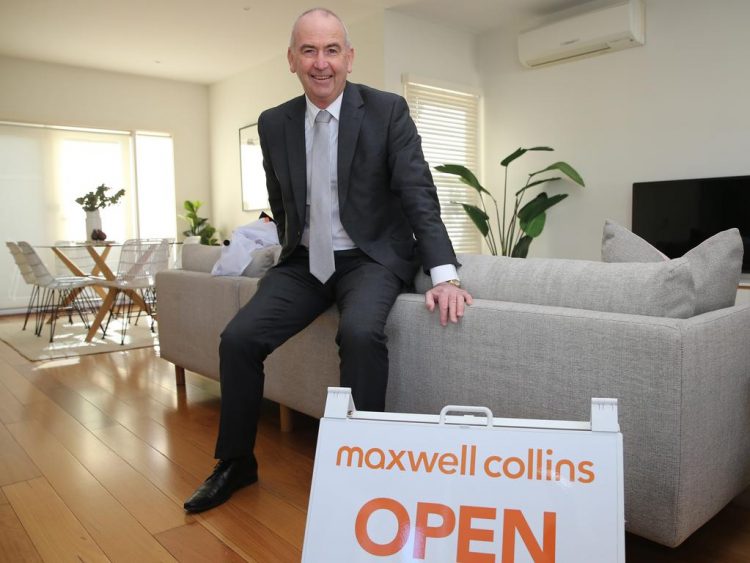
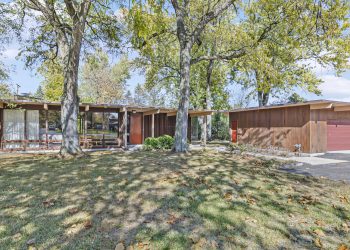
Maxwell Collins’ Eugene Carroll says rising interest rates have put brakes on the market. Picture: Peter Ristevski
New data has revealed the true pace of the slowdown in Geelong’s property market.
Time on market figures, which records the median number of days it takes to sell a property by private treaty in a suburb, were higher in the vast majority of Geelong suburbs than six months ago, new data from PropTrack reveals.
The biggest increases have been in inner west and eastern suburbs such as Herne Hill, Newcomb, Bell Park and East Geelong.
Across the entire Geelong region, the median days on market has climbed from 23 days in April to 29 days in October.
RELATED: Developer shovel ready to begin $130m Geelong project
Geelong home’s journey from uni digs to grand residence
Historic waterfront home driving big interest in city’s dress circle
In some suburbs, the data for sales in the 12 months to October showed the time to sell had doubled compared to the figures reported in April.
It shows that the Reserve Bank’s decision to push up interest rates to cool inflation is having an impact on the housing market in the region.
Houses in East Geelong spent the longest on the market at 56 days, up from 41 in April, with Manifold Heights also above 50, closely followed by Geelong West (48, up from 35), Herne Hill (45, up from 18) and Geelong city, where 44 days reflected a 12 day drop in the time to sell.
There was no change in Newtown or Highton.
BIGGEST RISES IN TIME ON MARKET (HOUSES)
Suburb
Median days
on market
6 month change in days on market
Median price
6 month change in median price
Lovely Banks
54
+31
$842,500
8.9%
Herne Hill
45
+27
$765,000
2%
Wallington
61
+26
$2,200,000
32.5%
Bannockburn
49
+19
$764,500
2.4%
Newcomb
20
+18
$615,000
0.8%
Bell Park
19
+17
$657,500
4.2%
East Geelong
56
+15
$945,000
12.5%
Bell Post Hill
39
+14
$690,000
3.5%
Geelong West
48
+13
$975,000
7.4%
Lara
29
+13
$720,000
2.8%
Source: PropTrack. Median days on market recorded for properties sold by private sale. Median price for sales recorded in 12 months to October
Wallington on the Bellarine Peninsula has the longest time on market at 61 days, up from 35 days.
Rising interest rates, which impacted how much buyers could afford to borrow, was putting the brakes on the property market, Maxwell Collins, Geelong agent Eugene Carroll said.
But particular suburbs and the motivation of vendors could also dictate the length of campaigns.
“Gone are the days of testing the market with a higher figure. If it’s too high, then you’ve got to over a period of time meet the market until buyers can see the value there.
“That can be a process – you’ve still got the optimism of getting a higher figure, but if it doesn’t sell within a reasonable time frame, the next course of action is to meet the market.”
Hayeswinckle agent Matthew Roberts (front) says more buyers are being advised to use finance clauses in contracts.
Ray White, Lara agent Terry Cleary said buyers budgets no longer stretched as far.
“If you’re going to blame interest rates, you’ve got to look at what affect interest rates have,” he said.
“And each buyer group, whether they are $900,000 to $1m, can now only afford $840,000 to $850,000, and $800,000 to $900,000 and so on, they’re all dropping,” he said.
“It’s fair to say we haven’t seen the number of sales slow down, but what’s happening is buyers have been refocusing their budgets and they are following their budgets.”
Hayeswinckle, Newtown agent Matthew Roberts said more buyers were being advised to use finance clauses, even when they’ve got pre-approval, to give banks more time for due diligence in the changing market.
“This spring, not as many auctions took place because we felt like we were only dealing with half the market because so many people were putting in a finance clause,” he said.
But the changing market was a golden opportunity for some to purchase below last year’s record prices, he said.
“There was a little bit of growing pains the first couple of quarters – the agents were in denial for the first three months and then vendors were in denial. Now everybody is pretty realistic.”
BIGGEST RISES IN TIME ON MARKET (UNITS)
Suburb
Median days on market
6 month change in days on market
Median price
6 month change in median price
Ocean Grove
62
+16
$885,000
4.1%
Herne Hill
29
+13
$387,500
3.3%
Manifold Heights
25
+12
$522,500
1.5%
Torquay
37
+12
$958,500
6.5%
Lara
48
+9
$480,000
-1%
Newtown
36
+8
$660,000
0.7%
Drysdale
15
+6
$550,000
7.8%
Norlane
26
+5
$460,000
19.5%
Belmont
24
+4
$550,000
-5.2%
Grovedale
19
+4
$535,500
3.9%
Source: PropTrack. Median days on market recorded for properties sold by private sale. Median price for sales recorded in 12 months to October.
Source by www.realestate.com.au

